echart图表
https://echarts.apache.org/zh/index.html
一个基于 JavaScript 的开源可视化图表库
静态html即可使用。
head段引入echarts库
<script src="https://cdn.staticfile.org/echarts/4.3.0/echarts.min.js"></script>body段准备DOM和初始化echarts实例
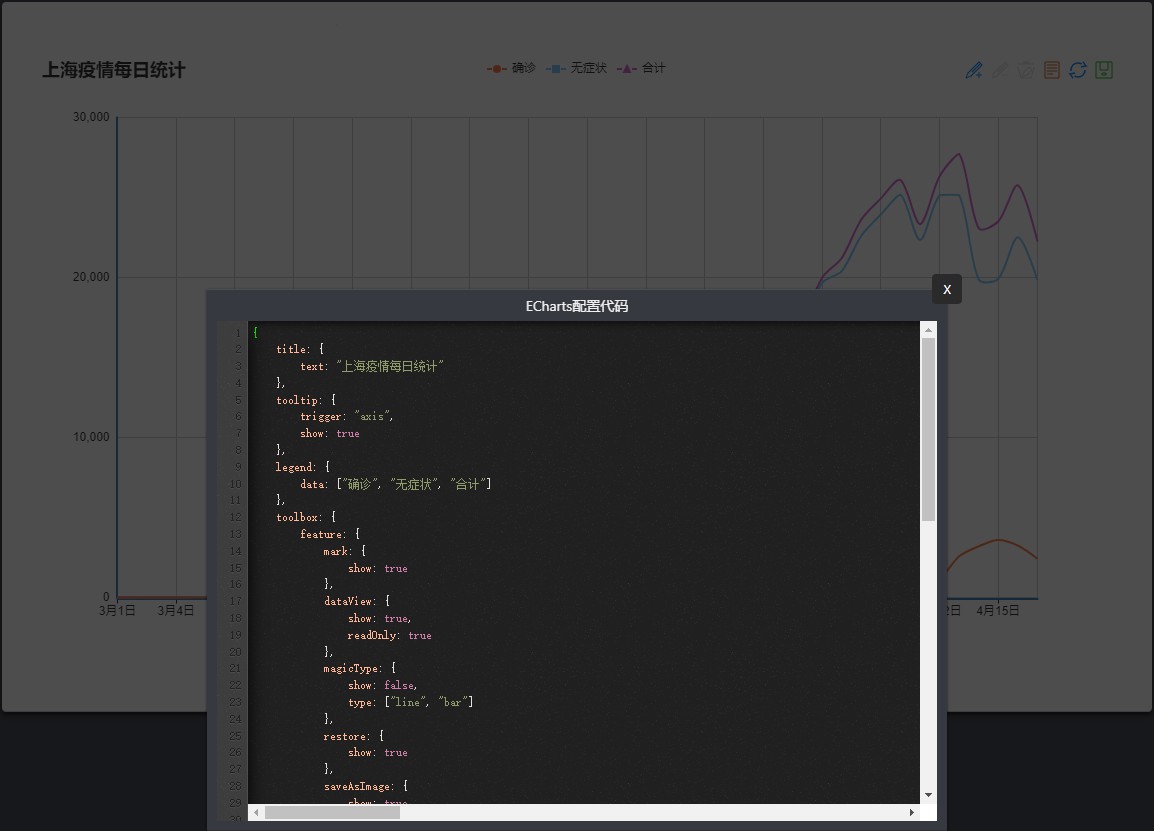
<!-- 为ECharts准备一个具备大小(宽高)的Dom --> <div id="main" style="width: 800px;height:600px;"></div> <script type="text/javascript"> // 基于准备好的dom,初始化echarts实例 var myChart = echarts.init(document.getElementById('main'));- 百度图说设计图表,将配置代码复制出来,放到echarts实例的参数中

实例
https://typecho.leosutopia.cn/shyq.html<!DOCTYPE html> <html> <head> <meta charset="utf-8"> <title>上海疫情每日统计</title> <!-- 引入 echarts.js --> <script src="https://cdn.staticfile.org/echarts/4.3.0/echarts.min.js"></script> </head> <body> <!-- 为ECharts准备一个具备大小(宽高)的Dom --> <div id="main" style="width: 800px;height:600px;"></div> <script type="text/javascript"> // 基于准备好的dom,初始化echarts实例 var myChart = echarts.init(document.getElementById('main')); // 指定图表的配置项和数据 var option = { title: { text: "上海疫情每日统计" }, tooltip: { trigger: "axis", show: true }, legend: { data: ["确诊", "无症状", "合计"] }, toolbox: { feature: { mark: { show: true }, dataView: { show: true, readOnly: true }, magicType: { show: false, type: ["line", "bar"] }, restore: { show: true }, saveAsImage: { show: true } }, show: true }, calculable: true, xAxis: [ { type: "category", boundaryGap: false, data: ["3月1日", "3月2日", "3月3日", "3月4日", "3月5日", "3月6日", "3月7日", "3月8日", "3月9日", "3月10日", "3月11日", "3月12日", "3月13日", "3月14日", "3月15日", "3月16日", "3月17日", "3月18日", "3月19日", "3月20日", "3月21日", "3月22日", "3月23日", "3月24日", "3月25日", "3月26日", "3月27日", "3月28日", "3月29日", "3月30日", "3月31日", "4月1日", "4月2日", "4月3日", "4月4日", "4月5日", "4月6日", "4月7日", "4月8日", "4月9日", "4月10日", "4月11日", "4月12日", "4月13日", "4月14日", "4月15日", "4月16日", "4月17日"] } ], yAxis: [ { type: "value" } ], series: [ { name: "确诊", type: "line", data: [1, 3, 2, 3, 0, 3, 4, 3, 4, 11, 5, 1, 41, 9, 5, 8, 57, 8, 17, 24, 31, 4, 4, 29, 38, 45, 50, 96, 326, 355, 358, 260, 438, 425, 268, 311, 322, 824, 1015, 1006, 914, 994, 1189, 2573, 3200, 3590, 3238, 2417], smooth: true, symbolSize: 0 }, { name: "无症状", type: "line", data: [1, 5, 14, 16, 28, 45, 51, 62, 76, 64, 78, 64, 128, 130, 197, 150, 203, 366, 492, 734, 865, 977, 979, 1580, 2231, 2631, 3450, 4381, 5656, 5298, 4144, 6051, 7788, 8581, 13086, 16766, 19660, 20398, 22609, 23937, 25173, 22348, 25141, 25146, 19872, 19923, 22515, 19831], smooth: true, symbolSize: 0 }, { type: "line", name: "合计", data: [2, 8, 16, 19, 28, 48, 55, 65, 80, 75, 83, 65, 169, 139, 202, 158, 260, 374, 509, 758, 896, 981, 983, 1609, 2269, 2676, 3500, 4477, 5982, 5653, 4502, 6311, 8226, 9006, 13354, 17077, 19982, 21222, 23624, 24943, 26087, 23342, 26330, 27719, 23072, 23513, 25753, 22248], smooth: true, symbolSize: 0 } ] }; // 使用刚指定的配置项和数据显示图表。 myChart.setOption(option); </script> </body> </html>